
All those boxes in your data center? They’re connected! They work together! That’s the brilliant insight that led Erik Dahl to develop the Zenoss Live Model, way back in 2006. And you know what? It’s still our special snowflake, and no one has copied it. Let’s look at the model, how it’s built and maintained, and the value it provides.
Every time you add a device like a router or a subsystem like a VMware farm to a Zenoss installation to monitor, you’re adding to the model. The model is built automatically, using the same protocols we use for monitoring. It’s maintained automatically, updated when change events are received and on a regular schedule where there aren’t any change events. No work for you, then. Hooray!
When something is added to a Zenoss installation to monitor, the modeler discovers its components. Different things we monitor have different components. For example, this Linux web server has Network Route, Interface, OS Process, File System, IP Service, and Processor components.

Looking at the IP Service component, we spot the network time server. How many ntp servers do you have in your data center? Thanks to the model, that’s an instant answer.

We’ve got eight ntp servers running. That’s probably too many for a production data center, but we’re a development shop. The model maintains a relationship between components and devices, and lets us navigate quickly either way.
The relationship between IP Service and Linux server is a simple one. For a VMware farm, the model is quite a bit more complex, with relationships between components.
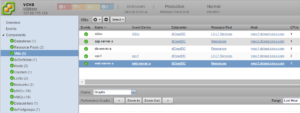
The VM component shows all the VMs in this (tiny) farm. But each VM has relationships to a virtual data center, a resource pool, and an ESX host.
And, three have relationships to a Guest Device. The guest is the operating system running in the VM, and if Zenoss is monitoring the operating system, it establishes a relationship between VM and OS. If you’re looking at the CPU utilization graphs for a VM and wonder what the Linux metrics are just click the link to go look.
The model connects related elements of totally different types. Knowing relationships helps operators know which system administrator to call, administrators get to the root of an incident faster, and managers improve the efficiency of their team and of their infrastructure resources.
Converged infrastructures really make the model shine. When you’re buying a converged infrastructure it looks like one vendor is really delivering a complete package. But then when it comes time to operate it you discover that it’s really multiple vendors with separate tools and it’s just hard to solve problems. Tom Cruise said it best. With the Zenoss model, “you complete me.”

Up to this point, all of the model has been completely automatic. Everything is discovered and maintained for you.
Now it’s time for fun with Service Impact! Now you can create your own relationships, grouping like and unlike things to create an application service. That’s next week’s post.
Interested in learning more? Enter your email address below to subscribe to our blog!