


In IT Operations, whatever you can do to pinpoint problems before they happen is priceless. Take, for instance, capacity planning.
When IT Operations teams don’t have the necessary insight they need into capacity trends, IT resources can grind to an unexpected halt when unplanned demand occurs. (This also explains why unplanned capacity is cited as the number one cause of availability and performance issues; see the Forrester Consulting survey "Amplifying the Signal in the Noise of IT Monitoring" for details.)
So how do you get insight you need to understand growing capacity risks and avoid future negative business impacts?
Put your crystal balls and tea leaves aside – Zenoss Service Dynamics Analytics (Analytics) just got a little bit better at helping you see into the future. Analytics offers much more than simply pre-packaged reports. Analytics provides a powerful way to transform data into actionable business intelligence. The comprehensive ad hoc reporting capabilities Analytics provides have been helping IT Operations teams recognize emerging trends with regards to capacity planning and infrastructure optimization for quite some time. But now, with release of Analytics 4.3.1, the predictive aspect of Analytics just got even better.
Step 1 — Create Nth Percentile Calculations
With the Analytics 4.3.1 release, you can take unprecedented control over predictive analysis – whether projecting for SLA compliance or capacity utilization. Analytics helps you in two ways. First, it allows you to create nth percentile calculations in your reports. The ability to create nth percentile reports allows you to knock out insignificant outliers – anomalous values that can skew data and give you faulty impressions upon which to base your projections.
Analytics provides various configuration options you can use to organize and analyze metric information suitable to your needs. For metric projection options, choose suitable definitions for the following:
- Percentile value to calculate (for example, 95th percentile)
- How many days of actual metric values you want to use to calculate future projections (for example, use the prior 60 days to project values 30 days into the future)
- Additional business hour days (for example, for different geographic regional office perspectives) to calculate in addition to the default 24 hour day
- Provide business context for additional time zones/regional work days in addition to the default 24 hour day aggregations
- Set of devices you want to analyze (for example, VMs and hosts)
- List of metrics for the devices to analyze (for example, network communication volume)
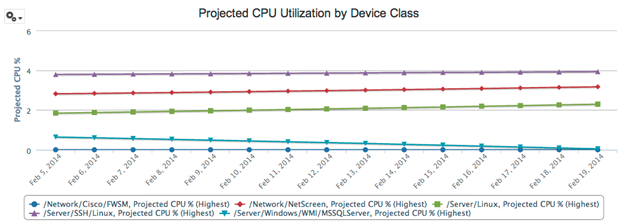
Step 2 — Project Values Into the Future
Once you have your nth percentile calculations created, you can project those values into the future. Define the time period of past data you want to be used as the basis of the analysis along with the number of days into the future that you’d like to predict. For example, you can predict network and server capacity requirement values 60 days in the future based on the previous thirty days of usage data. The report below shows for every defined business day what the projected usage will be 60 business days in the future. This analysis allows you to provide additional capacity necessary to safely manage the projected future usage needs.
Using the information in these predictive reports, you can prevent problems instead of waiting to react to business-impacting crisis situations. The shortest and least costly downtime is always the one prevented in the first place. Using Analytics can improve your ability to meet SLAs and reduce costs and business impacts associated with unplanned downtime and capacity limitations.
Learn More
For more information about the capabilities available in Zenoss Service Dynamics, check out the following resources:
- View the Zenoss Service Dynamics: Analytics data sheet to get a quick overview of all the capabilities Analytics provides.
- Watch our webinar, "Deep Dive: Unified IT Analytics" to learn more about how Analytics can help you reduce your MTTR, better optimized your IT resources, plan capacity more effectively, and ensure service quality.
New to Zenoss Service Dynamics?
- Watch a demo that gives you an overview of Zenoss and how Zenoss can help your more efficiently and cost-effectively monitor your environment.
- Read the Zenoss Service Dynamics: 4 Profiles in Unified Monitoring Success white paper to learn more about how some of our customers use Zenoss to improve their monitoring efficiency and productivity and avoid outages.
- Read the Zenoss Service Dynamics Architecture Overview to learn more about how Zenoss works.
- Request a free trial! See how you can use Zenoss more in your environment to more effectively and cost-effectively monitor and manage your environment using a single, unified monitoring view and unified monitoring processes.
Like It? Share It!
If you liked this article and want to share the word about the new capabilities Zenoss Service Dynamics 4.3.1 provides, feel free to share this article on LinkedIn, Twitter, Google+, or Facebook. Also, don’t forget to follow our blog to get the latest news and information from Zenoss!