


 Does it seem like every day we’re doing the same quick fixes? Deleting temporary files to free up space in a file system, bouncing a server, restarting a queue. Over and over. Whether automating these simple tasks or not, you’re responding to incidents that have already affected someone instead of making changes to prevent them from ever happening again.
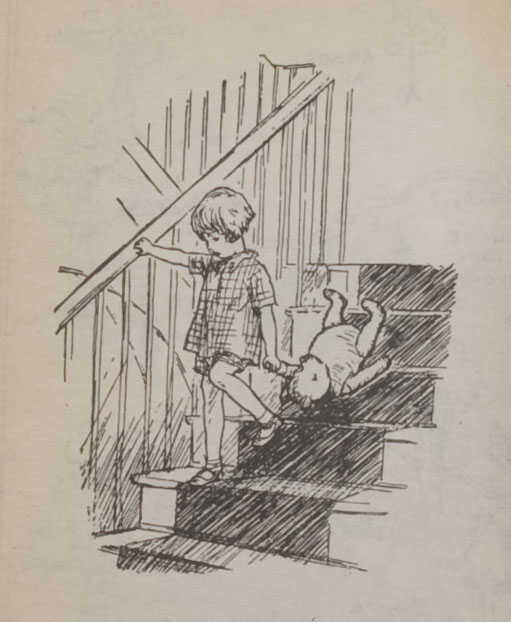
It’s just like the opening to “Winnie the Pooh”: “Here is Edward Bear, coming downstairs now, bump, bump, bump, on the back of his head, behind Christopher Robin. It is, as far as he knows, the only way of coming downstairs, but sometimes he feels that there really is another way, if only he could stop bumping for a moment and think of it.”
In our dreams, we’d spot incidents as they’re just about to start and kick off remediation actions immediately. Incidents killed in advance without anyone affected! No more repetitive, manual runbook tasks! Time to be intelligent and not a robot!
At Zenoss, we don’t want you to bump your head every day. That’s why we’ve added event analysis to Zenoss Cloud.
Event analysis helps you investigate recurring problems in order to determine how to prevent them from happening again.
Event Analysis at Work
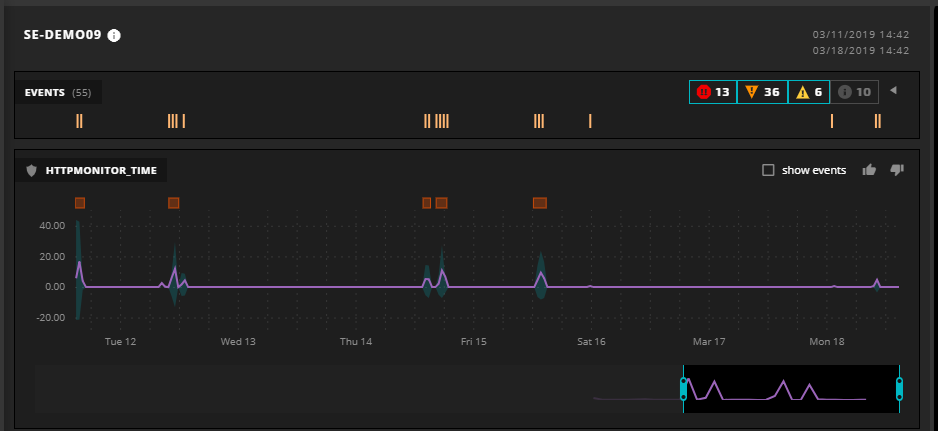
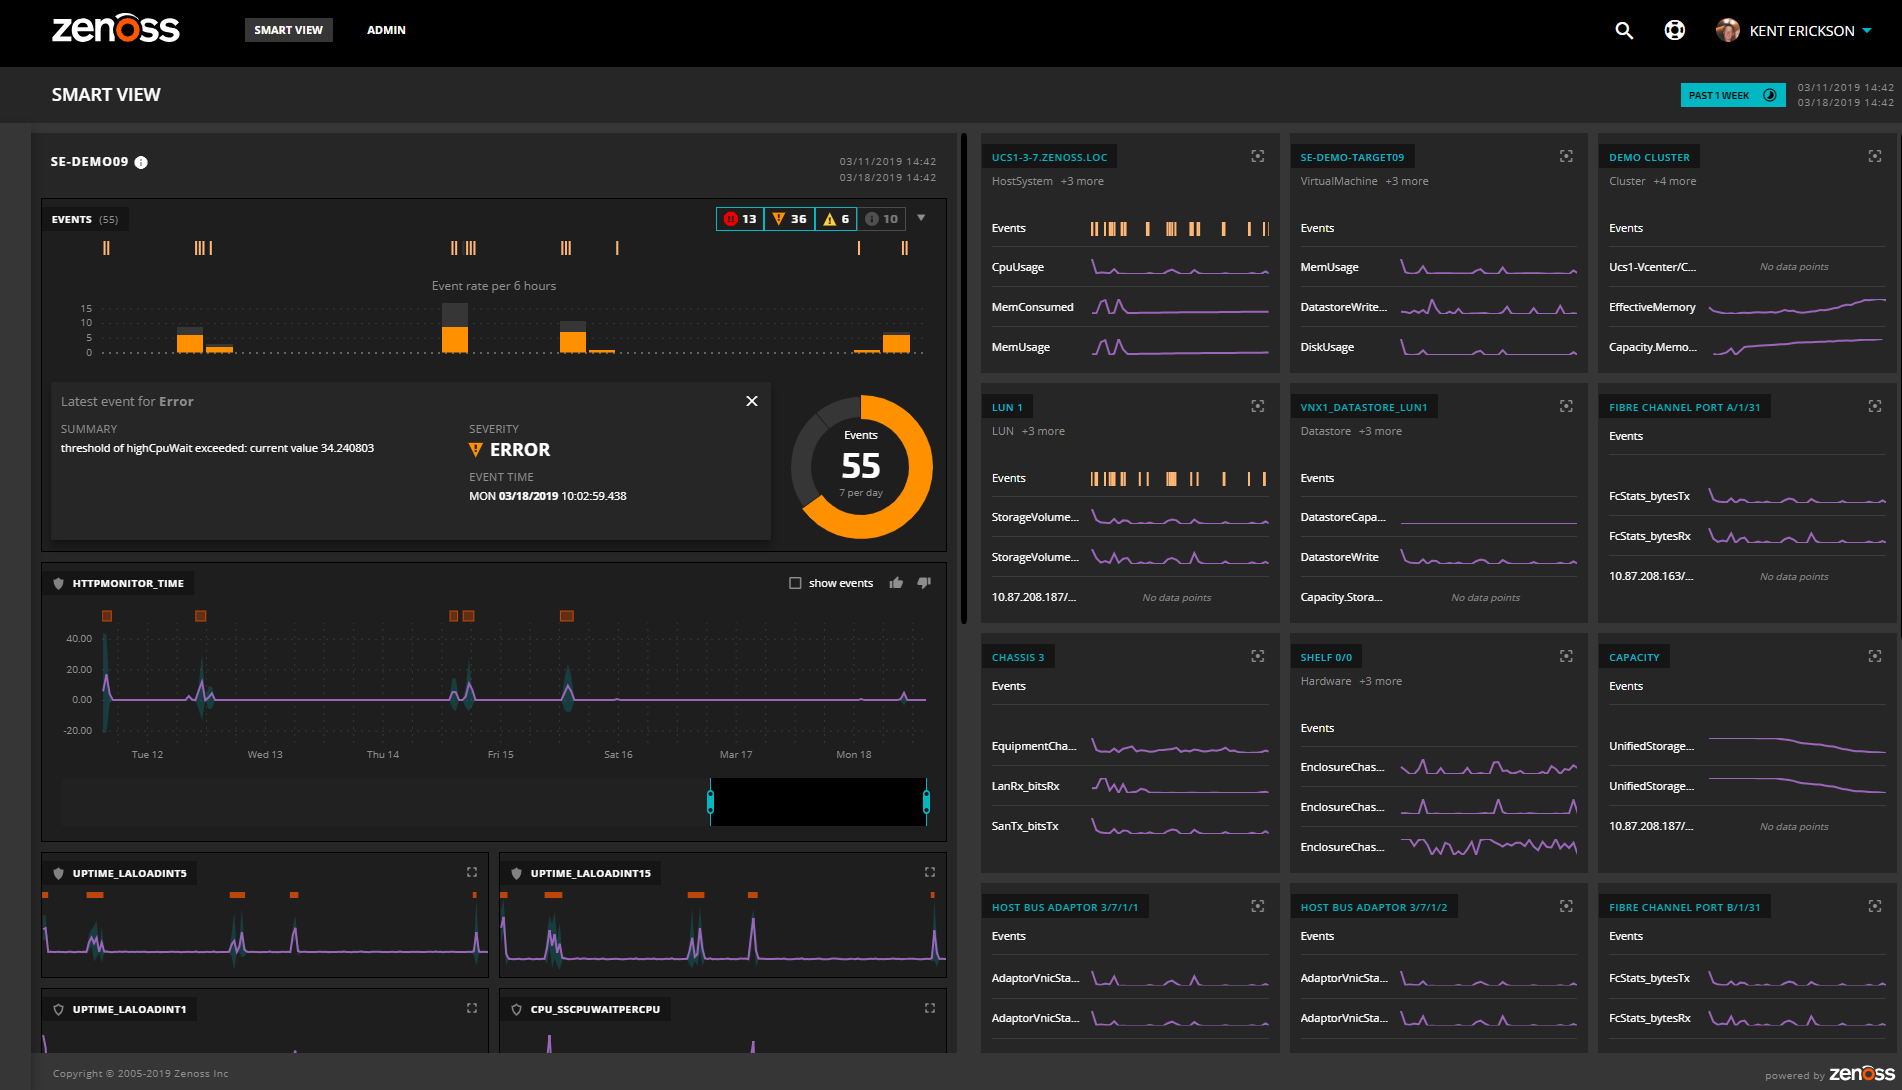
A Zenoss Cloud user points her SmartView at a web server OS that has received irregular reports of response time spikes. She clearly sees the response time issues identified by the orange anomaly bars and notes that there is an event cluster that matches each spike. SmartView is a great research tool that helps you investigate repeated incidents.
Expanding the event analysis, she further focuses by filtering on event severity, class, and name and identifies a repeated set of error events that match. She drills in and sees that high CPU wait conditions match the bad response time. In this time period, the operating system has been running on only one hypervisor, but if it had run on several, SmartView would have helped her discover that response time spikes were uncoordinated with hypervisor changes.
Since high CPU wait is usually caused by issues in the storage system (“Thanks, Google search!” she thinks.), she reanchors her SmartView to the LUN to investigate those events.
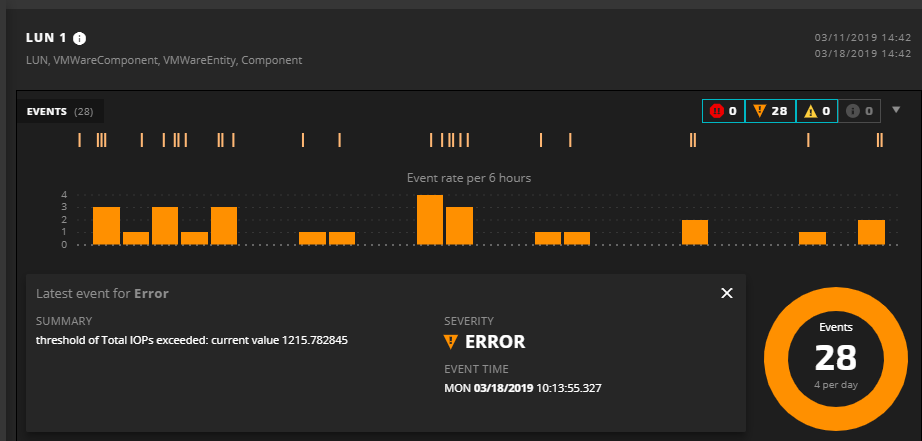
With just a few clicks, our administrator identified that an overloaded storage system was the key cause of the occasional slowdown in web response time. Something is designed badly — either the storage array is undersized for its task, or something needs to be moved to another array.
Ask yourself this question: Could you identify the cause of an occasionally slow website so quickly? Or would you just let it go on affecting people indefinitely?
Want to solve problems permanently instead of respond to incidents?
We developed event analysis from years of working closely with customers interested in improving IT operations. It’s a process we call #CustomersforLife and is core to our business model. The modern technology behind Zenoss Cloud let us move event analysis from the whiteboard to our customers.
We invite you to learn how Zenoss Cloud will help you monitor hybrid IT infrastructure simply and easily. See for yourself with a personal demonstration!