It seems like every data center vendor makes a big deal about how their product scales. Helping customers deal with metrics and events from thousands or tens of thousands or hundreds of thousands of interesting things is indeed a challenging problem. Promising scale is one thing – delivering it is another. Let’s drill deep into just one area to see how Zenoss ensures customer success.
Last year, we introduced a new Calculated Performance ZenPack that allows customers to generate new performance metrics from collected data and perform a variety of math functions — in real time, as the source data is being collected. We found and addressed interesting scale challenges right away.
The first widespread use of this feature was in the UCS Performance Manager product. UCS-PM provides deep insight into how the Cisco UCS unified fabric is performing. By themselves, the raw metrics provided by the UCS XML API weren’t sufficient to deliver this insight. Customers needed to know if configuration decisions they’d made were limiting the performance of their network fabric, and this required real-time comparisons between multiple metrics. We had to answer a variety of questions:
- Is the fabric traffic between each chassis and a fabric interconnect roughly equivalent – balanced - across the several connecting ports?
- Is the fabric traffic from each chassis balanced between the two fabric interconnects it’s connected to?
- If the fabric traffic across all the chassis to the fabric interconnects in balance? Or should some service profiles be rearranged to more effectively use the bandwidth?
- What’s the available bandwidth for an aggregation of ports? Is there capacity to add an additional workload or accommodate growth?
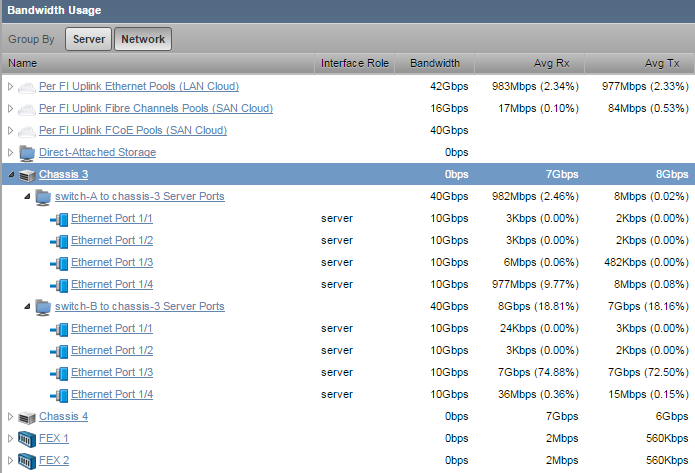
UCS-PM does the math to answer all these questions as it is collecting the raw metrics. It does statistical analysis across the ports in each fabric extender— for both fabric extenders in a chassis, for all chassis ports, for northbound SAN and LAN port channels, and more. What kind of math are we doing?
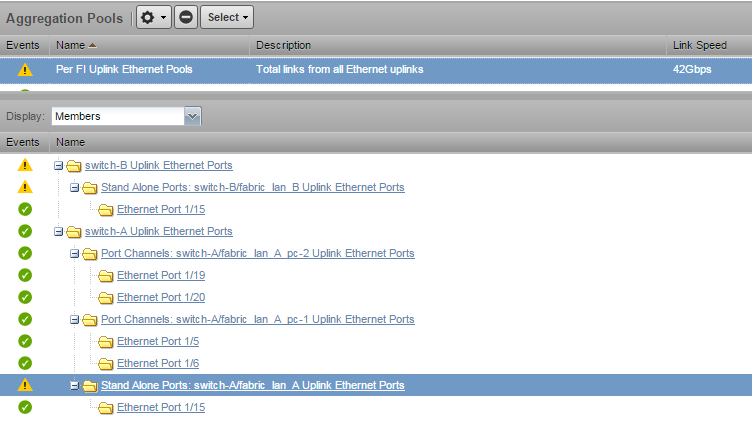
Here’s an example of the set of calculated data points for the LAN uplink from a UCS domain:
The first thing to note is the speed of the total uplink is 42Gbps. Do you have any 42 Gb ports? No, this pool represents four 10Gb ports and 2 1Gb ports, and we’re going to be doing analysis using that capacity. Of course, this is where the Zenoss Live Model is incredibly useful in helping us track the relationships between ports and port pools.
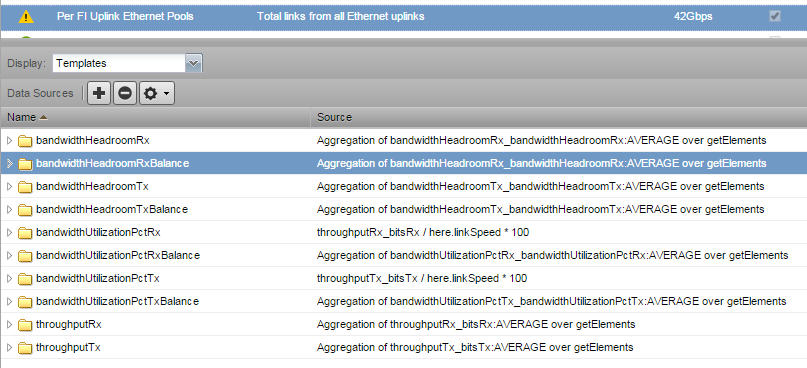
In the Templates section are examples of our calculated metrics. Between the Name and Source columns, you can probably guess what we’re doing, but there are several subtly cool features.
- In the template “bandwidthUtilizationPctRx,” we’re calculating a utilization percentage by dividing the throughput by the configured port speed. The raw metric wasn’t suitable as a percentage, but now we’ve got what we need.
- The“bandwidthHeadroomRx” template calculates available headroom across all the ports. Headroom is the unused bandwidth. We need to calculate it by subtracting the current utilization from the link speed for each port, then add the individual values together.
- And “bandwidthHeadroomRxBalance” performs statistical analysis of the utilization across all the relevant ports to generate a measure of whether any port is more heavily used than the rest.
- All the getElements functions calculate across all the relevant ports. Since we have the model behind the scenes, we don’t need to list the specific ports in our calculation, just “get Elements.” This means that we don’t need to change our calculations if we add capacity by adding another port to our LAN port channel. No extra work is a big plus!
What Are the Scale Requirements?
A well-populated UCS domain will publish tens of thousands of data points. And UCS-PM supports many domains, which means it does a huge amount of real-time math. We needed to know if this was going to present a problem.
Working with Cisco, we estimated the size of the environment we needed. We wanted to ensure great performance for 15 UCS Domains, fully populated to 2,400 servers. That’s more than 275,000 metric calculations every collection cycle.
Since we don’t have 2,400 UCS servers in our test lab, our test team wrote a metric generator. You know, that’s a whole lot of servers. It’s a good thing we don’t need to have 2,400 servers to test an environment that size!
Zenoss Version 5 Hyperconverged Software Architecture to the Front!
We performed the tests using the new Version 5 architecture.
Wait, what’s this “Hyperconverged Software Architecture” phrase even mean? Zenoss 5 is a containerized design based on Docker containers. We’ll write more about this on another day, but if you think about the capabilities of hyperconverged server hardware – need capacity, just add another server — and know that the Zenoss 5 application works the same way, then you’re in the right place.
Spoiler alert: We were able to deliver the required scale on a Version 5 installation with 148GB memory and 32 Xeon E5 cores. That’s a big server, but it’s doing a big job — collecting data from 2,400 servers and the unified fabric supporting them.
During the tests, we tracked CPU usage – right around 25 percent, disk IO, Network IO, memory usage, paging, and swapping.

During this time, we made a few code changes, in particular, speeding wild-card search support that we identified as potential bottlenecks.
But more than that, we learned about how to take advantage of Version 5. One of the great advantages of our containerized architecture is that it’s easy to adjust the number of processes working on a task.

The Calculated Performance ZenPack uses a component called ZenPython to do its math. During first testing, the system wasn’t able to keep up with the demand, even though there were plenty of server resources available. Increasing the number of ZenPython instances through Control Center allowed the system to deliver as needed. No code changes were needed, as Zenoss 5 automatically distributes requests across all the available instances.
The ability to add new instances of particular services is a huge advantage for customers dealing with scale requirements. In the past, customers might look to add an additional collector to address a requirement like this one. That meant a server and OS deployment and ongoing administration. Now, they can just spin up more service instances.
Summary
Delivering performance at the scale our customers need is important to Zenoss and is a key part of the intelligent data center.
We approach performance-at-scale needs using a structured process:
- Determining scale requirements
- Building generators to simulate large scale environments
- Measuring resource utilization
- Identifying and correcting code bottlenecks
- Optimizing system configuration settings
And then, we work with individual customers to help each one be successful.
How can we help you?
