Participants will each present a 10 minute trick, tip, configuration, or some other interesting thing that can be done with Zenoss. With a top prize of eternal bragging rights, an Apple Cinema Display, and no second prize the competition is sure to be fierce!
I’m upping the ante by publishing my hack ahead of time so my erstwhile competitors can see just what they’re up against.
In ten minutes, I’ll demonstrate three incredibly useful graph techniques. They’re available to every Zenoss user – open source or commercial – and demonstrate the value behind our open source platform.
Illustrate Availability
Our users start with one simple fact when they’re determining how IT is doing. Does the system even work?
Whether you’re planning new procedures to increase availability or trying to respond to a complaint, a picture is worth thousands of words and numbers.
Let this graph tell your story. “Over a six week period, we had only one brief outage.” Then move on to next steps. Bang, you’re productive again.
Really, this server isn't "always down." See?
To see the details on how to accomplish this hack, see my detailed writeup in the Community Forum.
Make the Unusual Pop-out
There’s nothing harder than being told to figure out what’s wrong with a server you’ve never worked with before. How the heck can you be expected to look at a bunch of events and KPIs and spot what’s strange behavior and what’s normal?
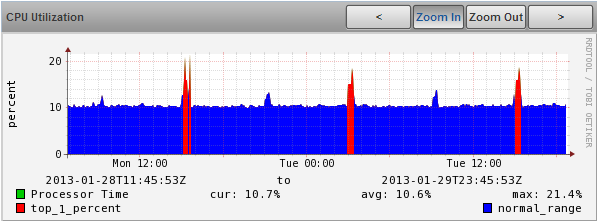
What if we could enhance our KPI graphs to make the unusual pop out?
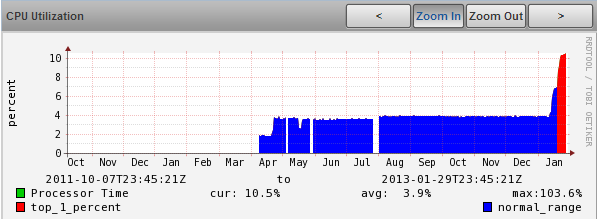
Can you spot a pattern here?
Yes, things really have changed recently.
Zenoss really goes to work here, putting statistical analysis right into the graph. Every point with a value more than 3 standard deviations out of line shows up in bright red, making it easy to spot patterns, changes, and random outliers. By the way, three standard deviations is just about the top 1%.
To see the details on how to accomplish this hack, see my post in the Community Forums.
Predict the Future
Every quarter your boss wants to know what, where, and why you need to spend to keep up with changing demand. We need more than an eyeballed graph – we need a trend line!
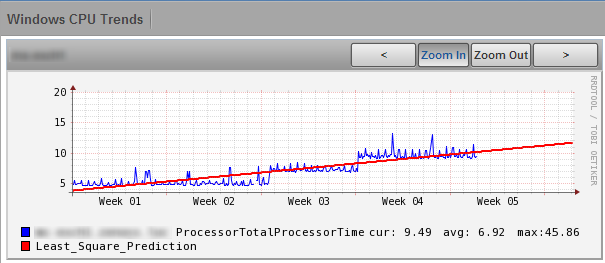
With just a few simple commands, we can add a mathematically calculated least squares trend line to any graph and extend it as far as we want into the future.
CPU usage is rising, but we won’t run out soon.
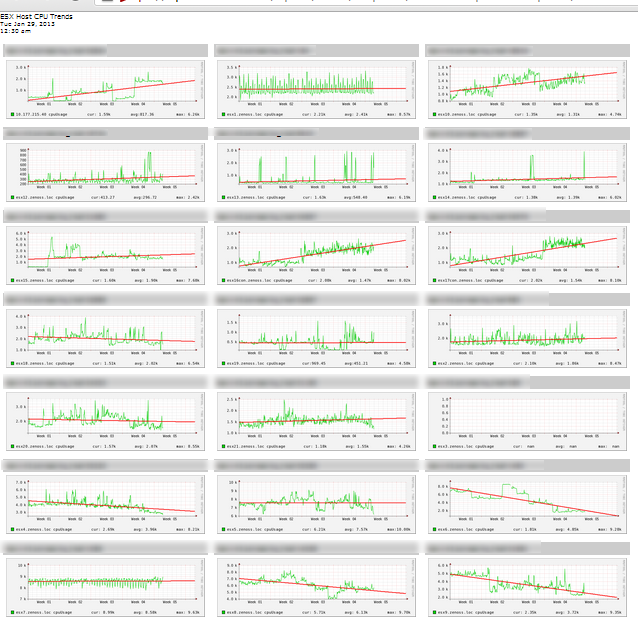
Whether we’re looking at changing usage on a single server or a single network interface, or reviewing usage across all the servers supporting an application, trend lines make our job much easier.
A few ESX hosts may be overloaded, but I see where we can shift work around
Trend lines are the easiest form of capacity planning, and they’re free to all Zenoss users!
To see the details on how to accomplish this hack see my post in the Community Forums.
Power of an Open Platform
We hear over and over from our customers that the single characteristic of the Zenoss product they most value is its extensible flexibility. Zenoss is easy to adapt to your specific needs, and I’m very happy to have been able to share a few simple techniques with you.
Now, off to convince my hacker competitors to share, too!
