Last week I introduced the Zenoss Live Model. Remember, it’s the outcome of Erik Dahl’s brilliant insight back in 2006 that things in your data center are connected. Sounds simple, but does your current tool set allow you to navigate up, down, and sideways?
The Zenoss Live Model automatically discovers relationships within a monitored element (a process runs in an operating system, a VM data store has a LUN,...) and between monitored elements (a VM has a guest operating system, a data store LUN is connected to a storage array,...) It works very well to help IT operations efficiently solve problems and understand resource usage.
By 2009 our customers started to understand the model and asked for the next step. They shared whiteboard drawings showing us groups of objects and asking us to make the mode visibile, and smart.
We tried, with a feature called Dynamic View - internally called “Swim Lanes”. Here’s one:
Dynamic views were attached to device groups and individual devices and showed the parts of the model that were relevant to people running VMware and Cisco UCS. Wow, this excited people!
Look at what you can see - a group (lane 1) made up of four monitored operating systems (lane 2) - and we can see which are virtualized and what hosts they’re on, and a good set of the UCS resources they’re using. A problem in any of the boxes to the right could cause a problem in the operating system it supports, and if the group is an application then we’re way ahead of the game. It’s really easy to spot potential problems. Well, some of them.
But the swim lanes were far from perfect.
- We needed more lanes than a screen could support, for one thing. That’s what you get when you start with a Powerpoint design and turn it into a user interface.
- Many of the most important relationships were missing entirely, like the link from datastores to storage arrays.
- We wanted to bubble up a status to the top. But how? A failed fan somewhere in a UCS domain probably didn’t even affect most of the blades, why should that cause the top level status to be Fail?
- And last, application services are made up of lots more things than operating systems. VLANs. Load balancers. Transaction checkers.
The Zenoss Live Model and Service Impact
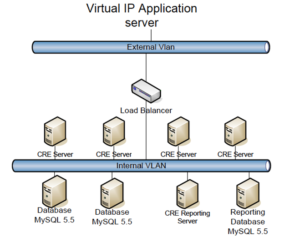
We had a lot of work to do. It took us nearly two years, but in 2010 we finally shipped a feature called Service Impact that delivered on those customer whiteboard drawings. And after five years of continuous improvement, you can create an application service that produces smart status for an application like this Virtual IP Application service.
Knowing that this service is working means tracking VLANs that rely on multiple switches, redundant front-end servers, redundant database servers, and reporting servers that aren’t critical to the application’s performance. That’s not a simple status rollup. Over the past several years we’ve improved the model to enable customers to rely on Zenoss analysis for complex applications like this.
The hard part, now, is defining applications. With customers having hundreds, even thousands of application services, we’ve been integrating with orchestrators and provisioning tools to automate the move into production and that’s showing strong success.
If you haven’t already, contact us to give Zenoss Service Dynamics a try!
