


Most of us want to track capacity used by our VMware hypervisors. CPU, memory, and disk utilization are standard host metrics that VMware provides and Zenoss Service Dynamics and Cisco UCS Performance Manager make available. But what about network usage? That’s a bit harder because there isn’t a host network usage metric. Let’s add one!
Each host will typically have several physical network adapters. Total network usage is therefore a sum across all the adapters. VMware provides metrics for each adapter, but doesn’t provide a nice easy sum. Zenoss software can do the math automatically for you.
We’ll start with the finished product, shown in a screen capture from UCS Performance Manager.

For each hypervisor, we have a new graph that shows total network utilization across however many physical network adapters the host happens to have. Perfect.
The rest of this article explains how to do it.
We’re going to be using the new-ish Datapoint Aggregator function. For Service Dynamics customers, it’s part of the Calculated Performance ZenPack first shipped last March and it’s standard function in UCS Performance Manager.
Step 1: Extend the Host Monitoring Template
We want new data for every host, so we’ll extend the default monitoring template.
Navigate to the system-wide monitoring templates and search for “host” to locate the VMware host template.
Add two new data sources of type Datapoint Aggregator. I called mine TotalPNICRx and TotalPNIXTx but those are just names.

To grab data from the network adapters, use the Target Method “pnics”. The Datasource and Datapoint are each nicRx for receive, and nicTx for transmit. You can find those values in the PNIC template, btw.
After you’ve added the Data Sources, you’ll need to add a Data Point to each one, using the gear menu. The Datapoint tells the Aggregator what to do with the metrics. We want a total, so we’ll use the “sum” operator. You might want to add an additional datapoint using the max operator if you’re worried about the highest utilization for any of your network adapters.

Now you’ve configured the system to create two new metrics for each VMware hypervisor, total of transmit and receive network usage.
One thing you’ll want to understand is that the Datapoint Aggregator does its math at collection intervals against the data that was collected last interval from the pNICS. You’ll see that if you closely inspect the graphs we’re about to create. Since we’re mostly interested in capacity measurements, it hardly matters if we’re off by a minute or five.
Step 2: Add a graph
We’ve got data, now it’s time to create some graphs.
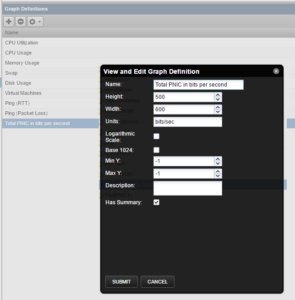
Add a new graph and give it a name. The name I picked is kind of dumb, because it includes the Units in the title. You’ll probably just want to type in the Units field for a y-axis label.
For UCS Performance Manager version 2 and Zenoss version 5 customers, setting the graph width to 600 will make this new graph the same width as the other hypervisor graphs.
Now add the two new datapoints to the graph.
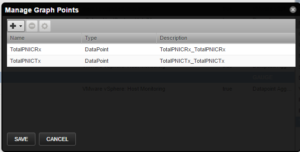
We need to do some math against the datapoints before we show them on the graph. You see, the data is collected in bits and we humans think in Kibibytes. That’s what Chet told me, anyway. So edit the graph point and use the RPN field to multiply the by 8,192. Just dig up that old memory of how to use an HP calculator - I’ve always been partial to the 12C.

We’re done! Now we can just look at a graph to figure out how much total network capacity each VMware host needs.
Acknowledgements
Thanks to Chet Luther for his invaluable assistance with this post.
Interested in learning more? Enter your email address below to subscribe to our blog!