

 It is increasingly clear that tools developed to keep a single system or a small cluster running are no longer sufficient in today’s highly distributed, complex environment. The tools that offer service assurance must be able to move their way through complex systems and prevent slowdowns or application failures. These complex systems now include physical systems, virtual systems and even systems found in a cloud service provider’s data center.
Monitoring should help you to clearly understand how performance and availability degradations impact overall service delivery while uncovering trends and patterns that help you improve troubleshooting, service reliability and quality across the technology stack. A new set of tools that offers service assurance rather than merely offering high availability is needed. These tools will be able to monitor and manage all the components of the IT infrastructure rather than just a few selected components to achieve the goal of preventing service interruptions that have a negative impact on users.
Viewing the performance of your current services from the application level down through the entire stack — network, storage, compute and more — is a critical component of the solution. With the deepest visibility, dashboards can present information down to the component level, providing the ultimate granularity on resource availability, contextual risk, and the end-to-end IT service dependencies that your infrastructure stack supports. This aligns IT Ops and DevOps teams with a common view of overall service status, dependencies and risk. This alignment is critical to effectively prioritizing troubleshooting tasks and expediting root-cause analysis.
Dashboards From Zenoss
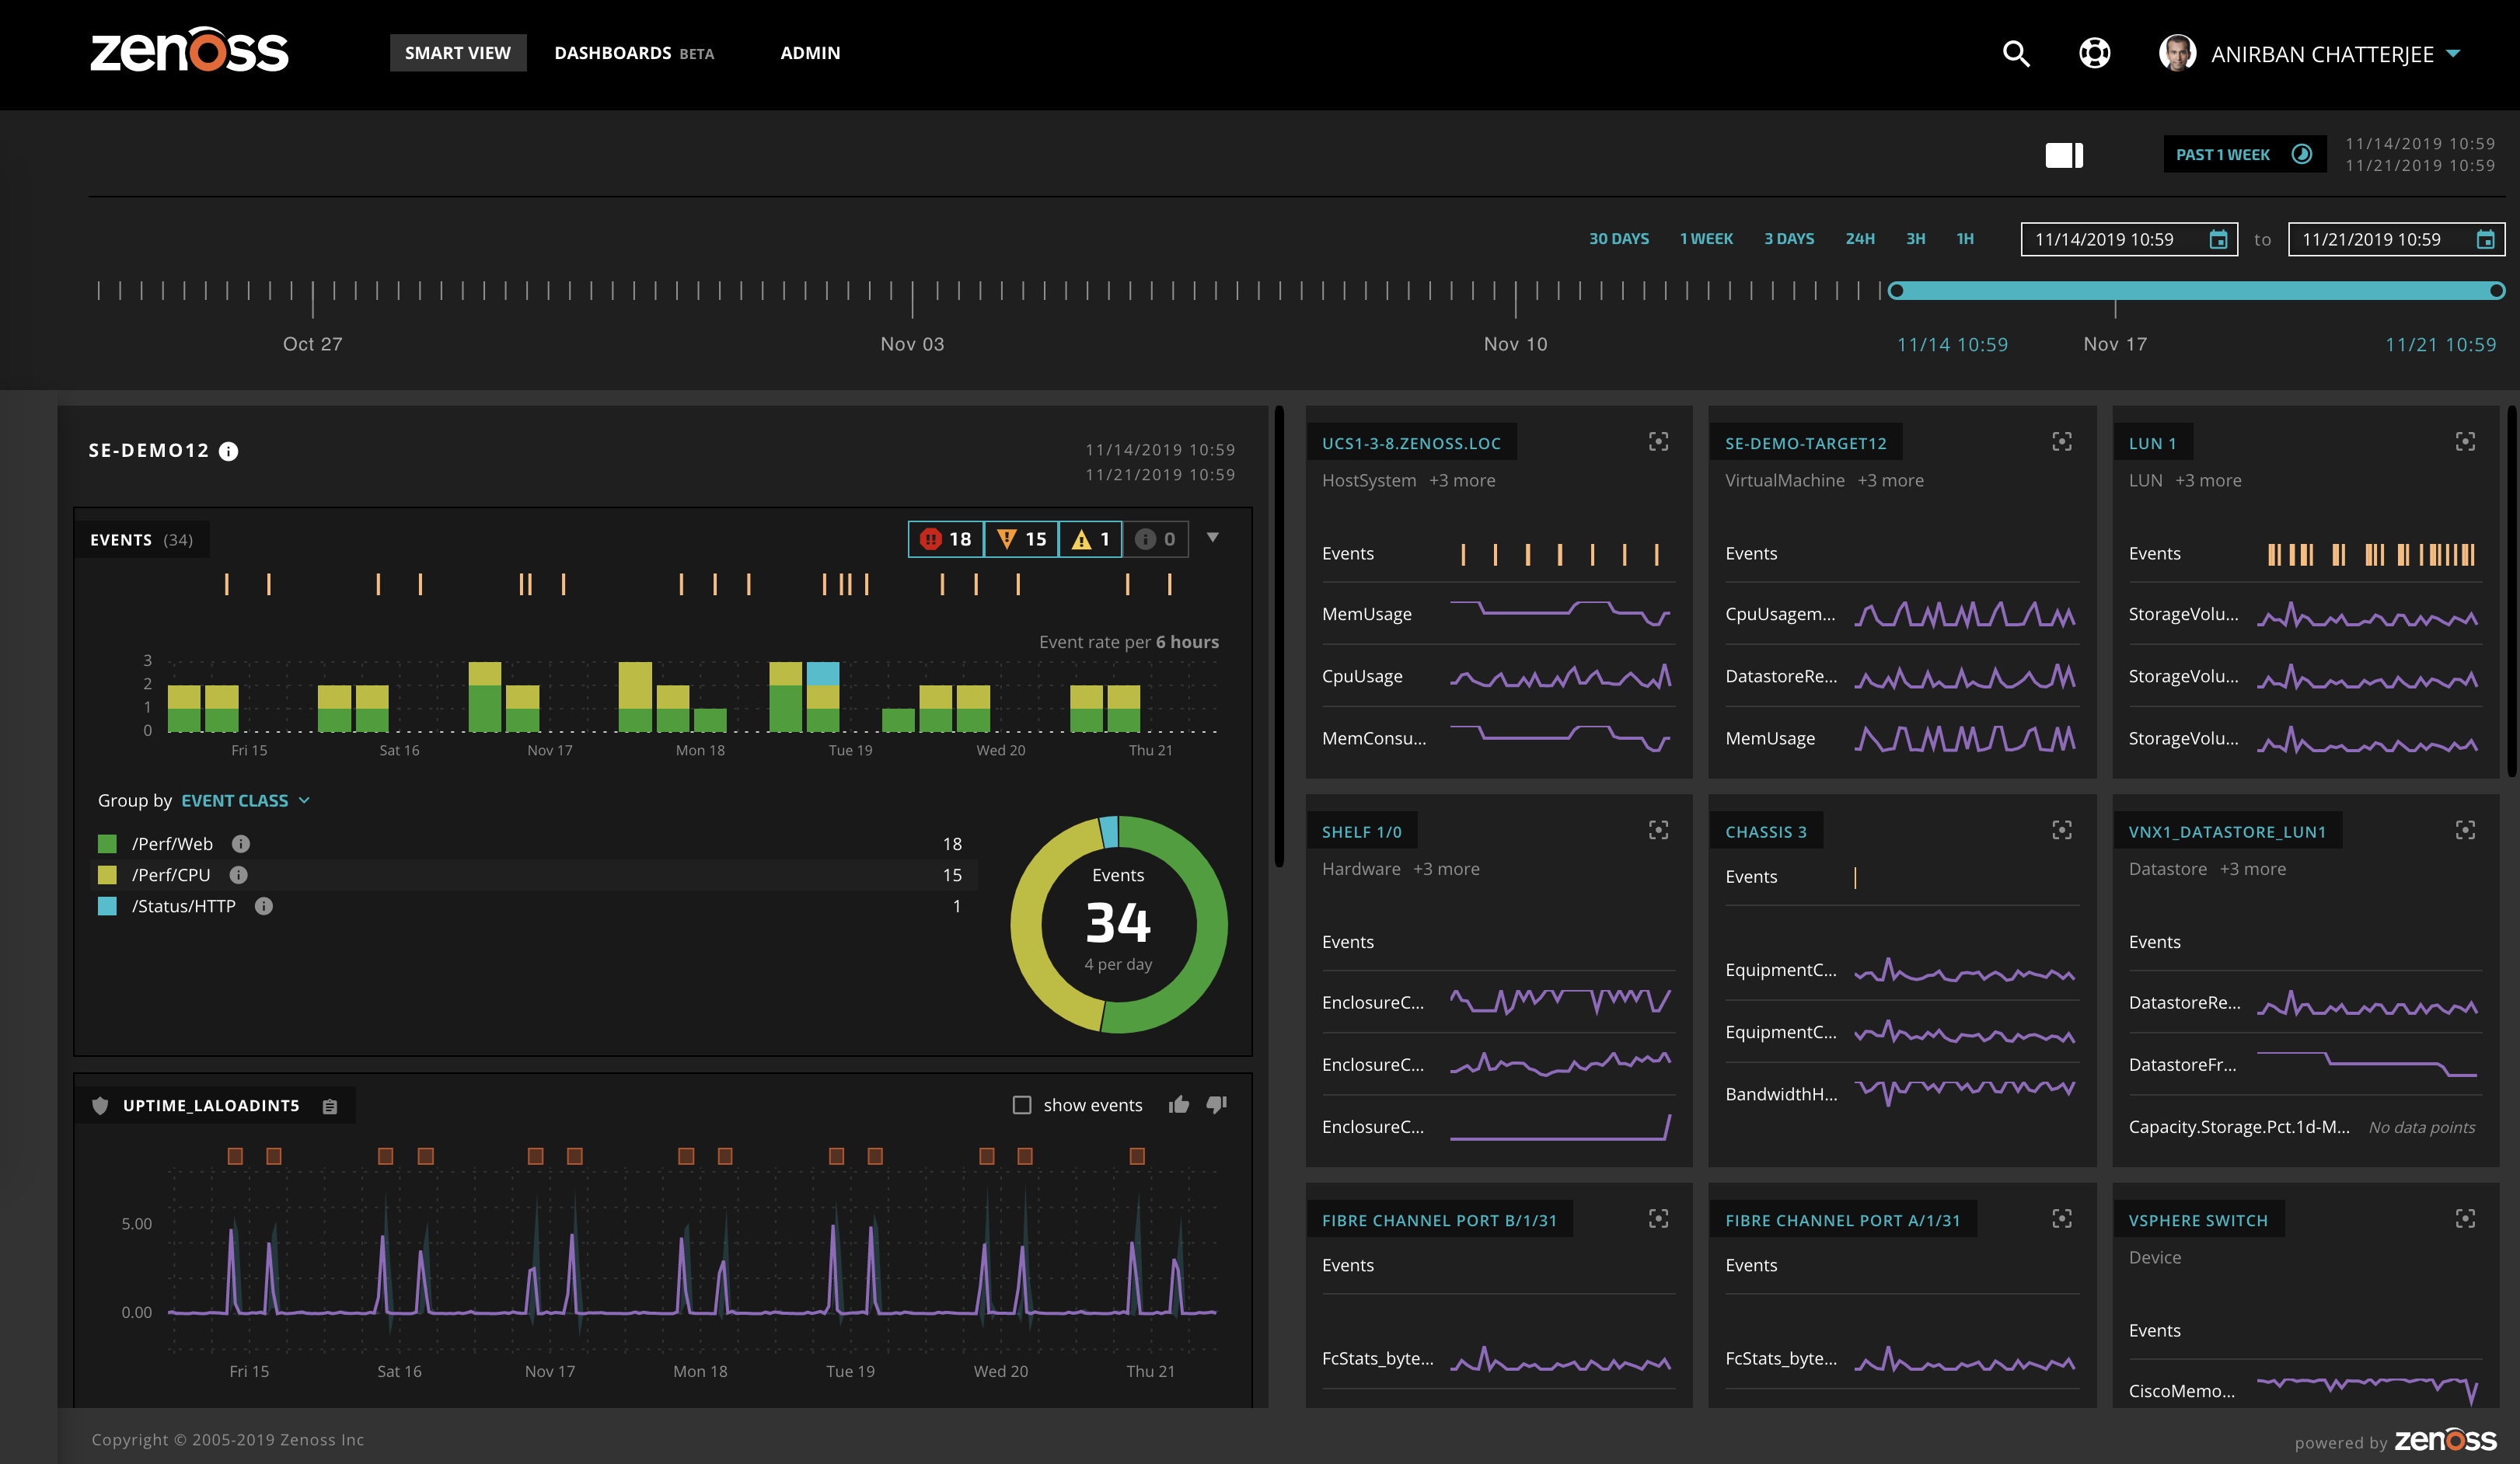
Zenoss supports top-level dashboards that give customers the ability to create executive level, application/service-level, and infrastructure-centric views that go down to individual technologies and metrics. They can be scoped to include only the devices that matter to that team. A wide variety of visualization widgets allow the viewer to observe current health and historical trends, and a dynamic timeline enables immediate exploration into historical performance.
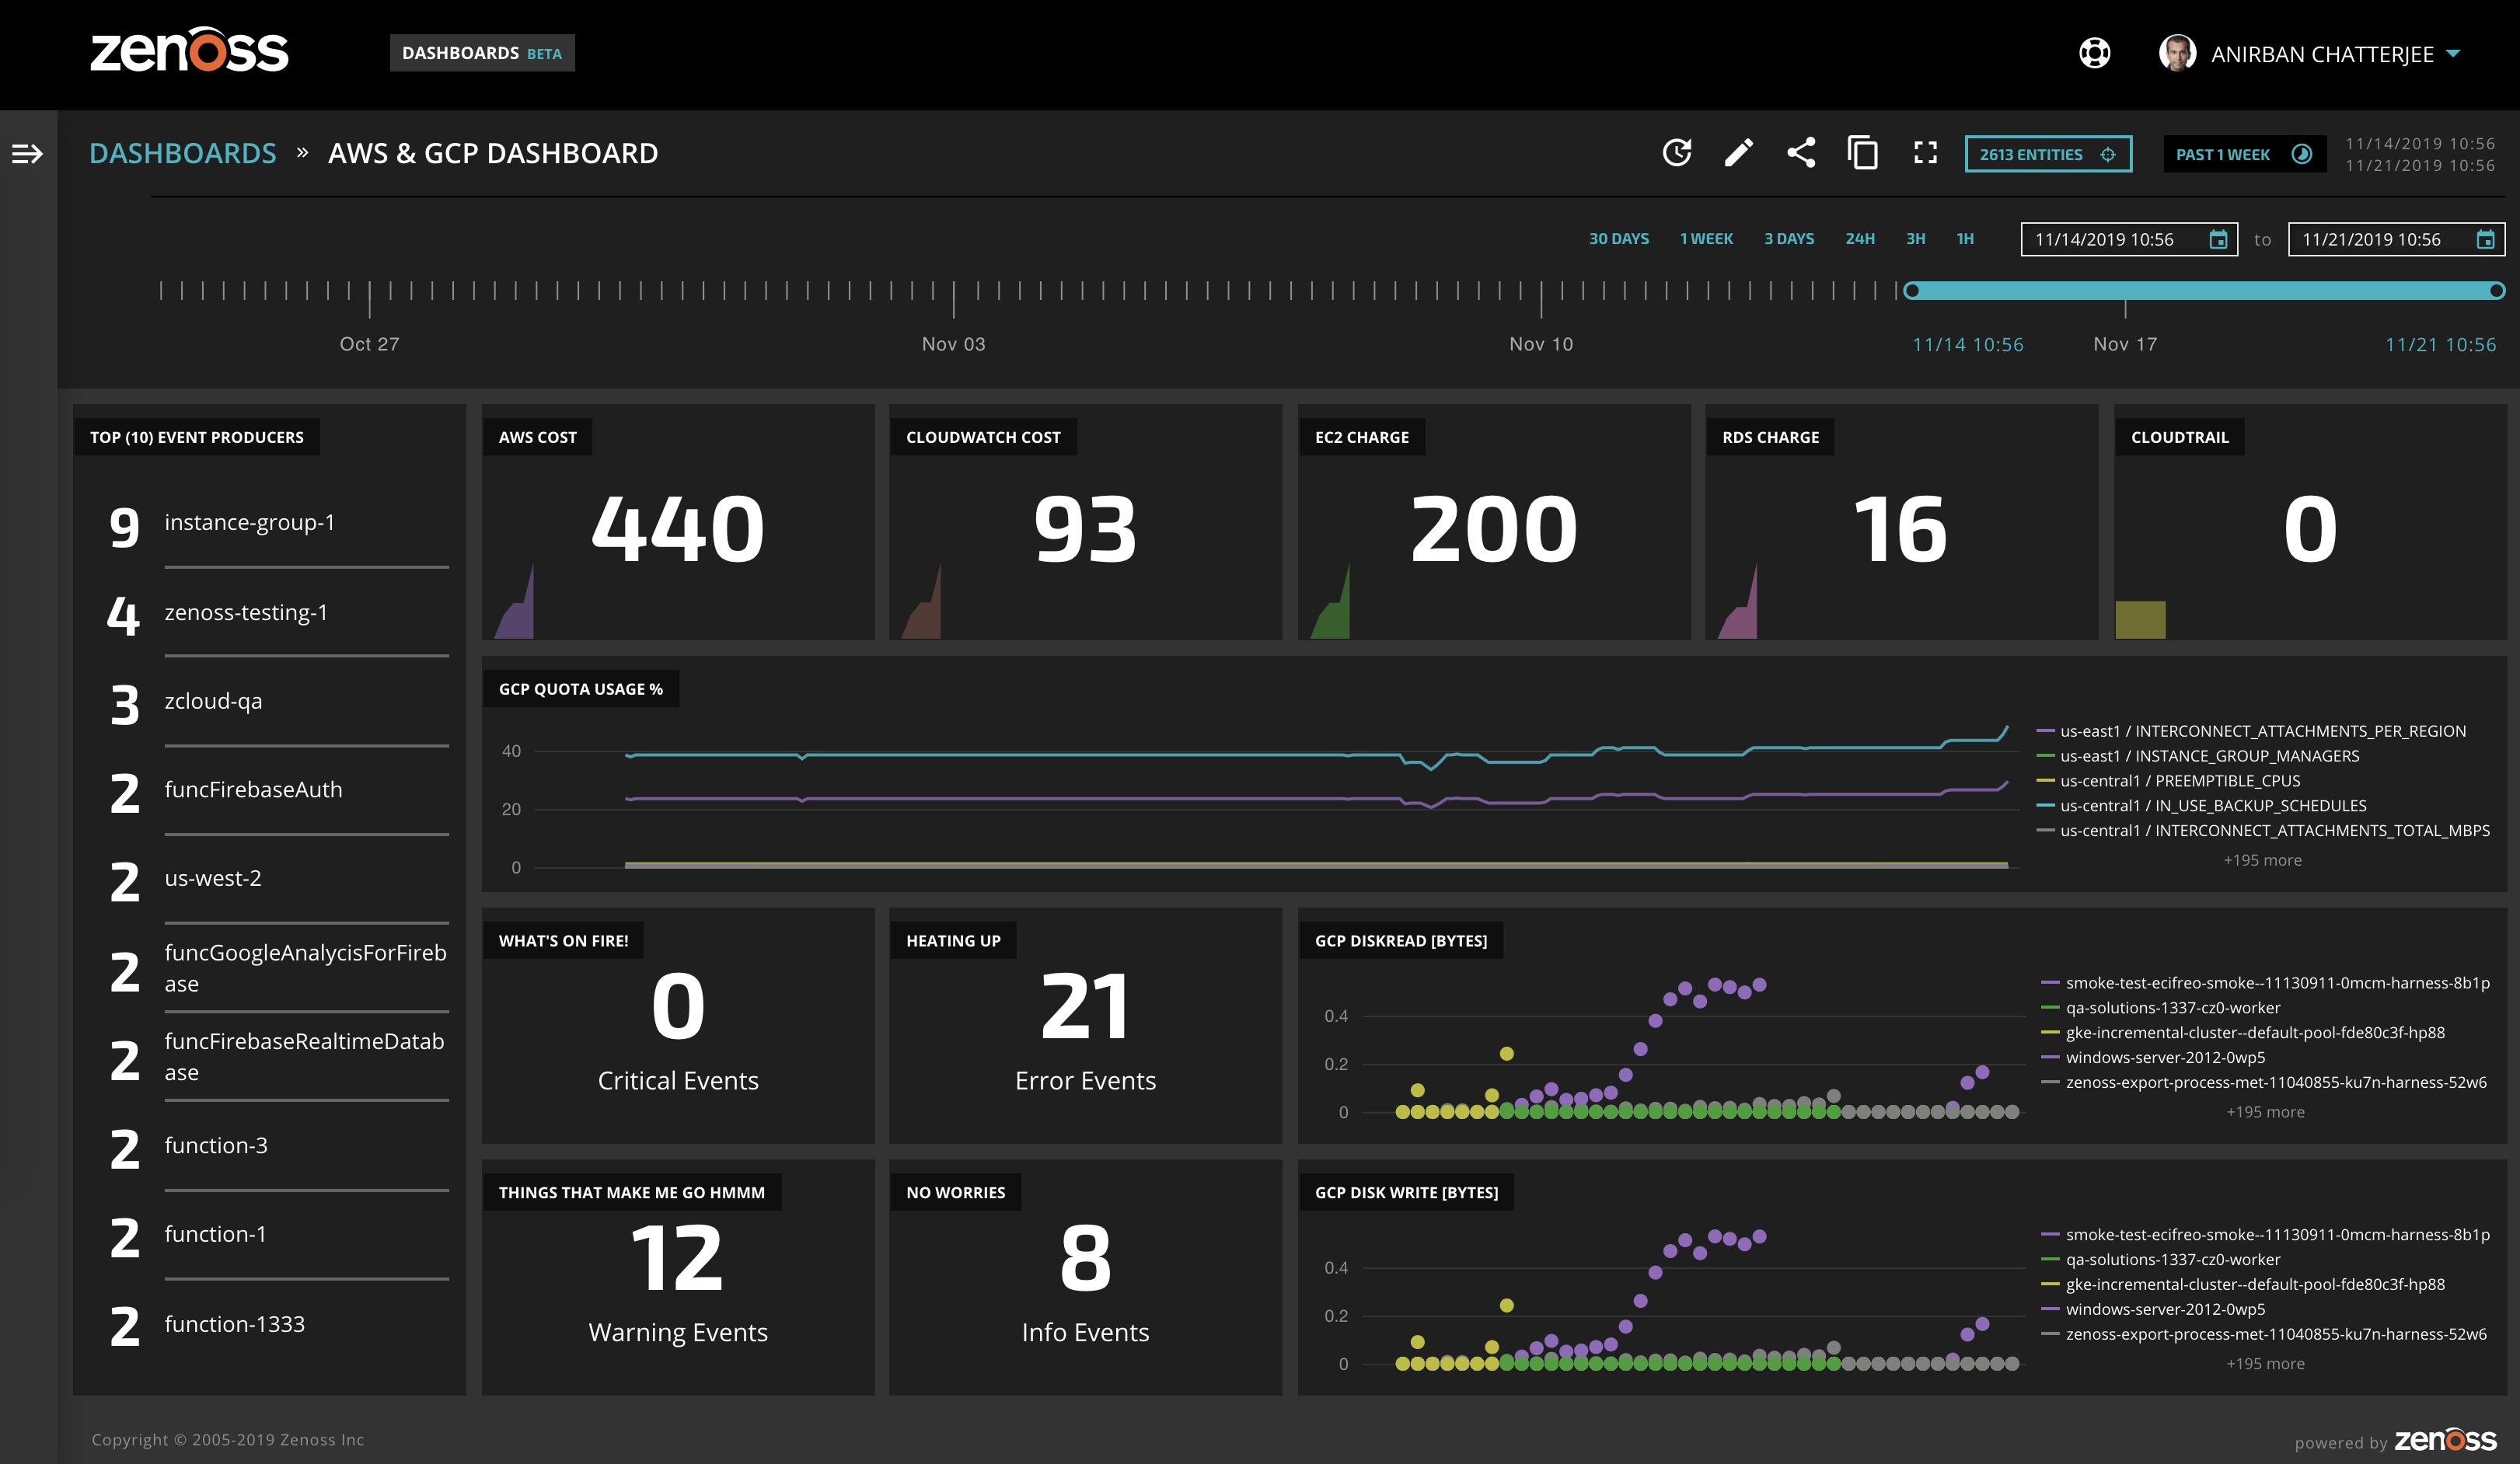
Additionally, Zenoss leverages AI-driven dynamic Smart Views, that create an intelligent user interface based on user interactions. For instance, Zenoss Smart View displays the most relevant information to a particular device or resource on the top based on the event data collected from different sources, including event severity, event class, and event name, as well as the time each event occurred. This makes things easier for IT Ops to quickly identify and troubleshoot issues before they impact user experience.
With Zenoss, an open API allows DevOps teams to build monitoring into their projects from the beginning. It collects custom metrics using gostatsd to provide insights to understand implications on applications. Zenoss helps you adopt customer experience measurement capabilities by tracking native synthetic transactions through integration with third-party solutions.
If you’d like to learn more about dashboards in Zenoss Cloud, schedule a demo today.