Event consoles are notoriously busy, and it’s a good thing that the Zenoss event management system has a bunch of tools for reducing noise. But where do you start?
Here’s a question that came into our support team recently.
“We're trying to optimize our alerts. We have a lot of devices that make a lot of noise, due to poorly tuned or just not very optimal checks. These can result in lots of false positives to our oncall staff, who are starting to ignore things as a result.
Anyway, I'm hoping to generate a report that would show me the top 50 (or even top 10, just a top list) of the "noisiest" devices. This means, which devices have generated the most events over the last 30 days."
Nick Turpin of our support team came up with a great solution that lists the event count for each monitored device and lets you export the report to Excel for easy manipulation. You can copy his solution in less than five minutes.
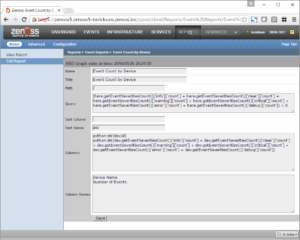
We’re going to create a Resource Manager event Custom Device report, so navigate to the Reports tab, click the lower-left hand corner plus button and select the Custom Device. I put my new report into the event reports folder and called it Event Count by Device.
The fill in the wizard fields as shown.
Here’s the text for easy copy-and-paste. Who wants to type, anyway?
Query:
(here.getEventSeveritiesCount()['info']['count'] + here.getEventSeveritiesCount()['clear']['count'] + here.getEventSeveritiesCount()['warning']['count'] + here.getEventSeveritiesCount()['critical']['count'] + here.getEventSeveritiesCount()['error']['count'] + here.getEventSeveritiesCount()['debug']['count']) > 0
Columns:
python:str(dev.id)
python:str(dev.getEventSeveritiesCount()['info']['count'] + dev.getEventSeveritiesCount()['clear']['count'] + dev.getEventSeveritiesCount()['warning']['count'] + dev.getEventSeveritiesCount()['critical']['count'] + dev.getEventSeveritiesCount()['error']['count'] + dev.getEventSeveritiesCount()['debug']['count'])
Column Names:
Device Name
Number of Events
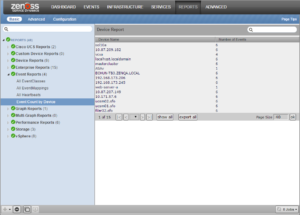
Now save the report, and run it. Here’s the result from my not-very-busy system.
Notice the export all button, which copies the report to your laptop as a .CSV file.
Once you find the busiest devices you can look at the detailed events and determine whether you need to change settings for the device to make it less chatty, apply some automatic event classification to move unimportant events directly to history or just discard them, use event transforms to alter severities, or turn on flapping detection to wait for important series of events.
There are lots of tools, and with this report you’ll have a starting point.
By the way, how many of your vendors have support teams that come up with solutions like this?
Please provide your email address below to subscribe and enjoy reading updates right from your inbox!


