This proliferation of siloed management technologies and information often prevents centralized views of overall IT health, common workflows, or cross-silo root cause analysis. “War rooms” are convened more frequently and often devolve into arguments over whose monitoring tool metrics are correct.
Centralized integration of multiple monitoring tools
Zenoss Service Dynamics (ZSD) is frequently brought into manage the chaos of multiple monitoring tools. With ZSD, customers gain consistent event and incident management workflow integrations. Integrating disparate monitoring sources also avoids duplication of information collection, analysis, and storage.
Leveraging its patented service-based management, ZSD can also overlay Quality of Service (QOS) and Application Performance Monitoring (APM) information sources to correlate against application infrastructure problems. This powerful combination can substantially reduce both problem Mean Time to Know (MTTK) and Mean Time to Repair (MTTR) intervals by understanding:
- Service Availability
- User Impact
- Infrastructure Root Cause
In many cases, customers have leveraged Zenoss as the key mechanism enabling data-center-wide consolidation and simplification initiatives. First, they integrate the existing monitoring sources into Zenoss to achieve centralized views and workflows. Over time, the various monitoring technologies are converged into a smaller, simpler, and more cost-effective set. This also avoids the inherent risks of alternative burn-the-bridge, rip-and-replace approaches.
Simple configuration integration — no custom coding
ZSD makes it easy to integrate external alerts via simple configuration changes and without any custom code (i.e., no ZenPack development required). The simplest integration is to have Zenoss convert common alert notification types from other utilities into Zenoss events. Customers can then augment and manage these alert-converted events the same as any other Zenoss event.
Options for converting alerts into Zenoss events
The following are the most commonly used Zenoss integration options to third-party alerts:
-
- ZenMail SMTP Server — Email alerts from third-party monitoring sources are configured to be sent via the Zenoss Mail SMTP Server daemon. Upon sending a third-party alert email, ZenMail parses the email content to fill in a new Zenoss event’s device, summary, and detail fields.
- ZenPop3 — Email alerts from third-party sources sent to an actual email server (instead of one simulated by ZenMail) are retrieved from that email account and similarly parsed into Zenoss events via ZenPop3.
- SNMP — On monitoring sources providing SNMP interfaces, standard Zenoss SNMP collection is configured to convert traps into Zenoss events.
- JSON API — On monitoring sources supporting custom alert interfaces, the alert is configured to invoke the Zenoss JSON API directly or via curl.
- ZenSendEvent — Invoking the zensendevent command is an alternative to directly creating a Zenoss event via the JSON API.
Event context and content augmentation
Once third-party alerts are converted into Zenoss events, you can further enhance the event context and content beyond the information provided by the originating alert.
The Zenoss event mapping and transformation system allows you to perform a wide range of changes to event content on nearly every field of an event.
The system provides:
- Altering event severity — Change the severity if you don’t want to use the severity assigned by the originating monitor source.
- Filtering events — Match events needing transformation based on event class, rules, or regular expressions.
- Adding explanations — Enhance event understanding by adding explanation text content.
- Adding resolutions — Suggest common workarounds or instructions on actions to take for this event.
- Executing Python scripts — Provide custom analysis of event content, as well as accessing other data sources to transform event content.
- Example 1: Add URL callbacks into the event to launch the original alert monitoring source UI and view additional alert details, reports, or diagnostics.
- Example 2: Query a CMDB to identify and add the related configuration item (CI) identifier into the event.
Zenoss UC Insight event integration example
The new Zenoss offering of UC Insight with Log Analytics monitors Unified Communications Quality of Service such as for voice over IP, video communications, and computer internet connectivity.
Zenoss UC Insight with Log Analytics leverages configuration options described earlier to both convert UC alerts into Zenoss events and enable cross launching into call path diagnostic workflows.
In this example, a Unified Communications service model defines a service context around both UC infrastructure and quality-of-service logical nodes. Zenoss Service Impact analyzes the service model against all events. Whenever this analysis identifies that the UC Service is impacted, it generates a corresponding service event.
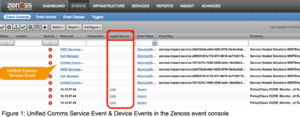
In Figure 1, service events appear for the Unified Communications service in the Zenoss event console. Events for the UC resource 10.13.37.44 also appear with a new, augmented field “Insight Source” that contains URL callback links to the original UC alert details.
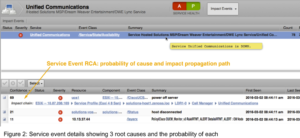
The operator clicks on the indicated Unified Communications service event to see the root cause details in Figure 2. The highest root cause probability is expanded to show how an event affecting ESXi infrastructure was propagated through the model until it resulted in generation of the Unified Communications Service Event.
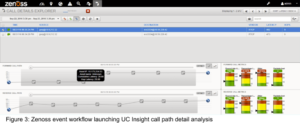
In Figure 3, clicking the 10.13.37.44 event Link field launched the Zenoss UC Insight Call Details Explorer to further diagnose the problem, gather additional details, and triage the call paths affected by the problematic infrastructure.
Summary
Of course, creating a custom ZenPack enables much more elaborate integrations with multiple, third-party monitoring utilities. However, you can create powerful integration results with Zenoss Service Dynamics with simple configuration changes alone.
Enabling easy integrations allows Zenoss customers to achieve centralized management across their datacenter(s) and quickly focus more efforts on strategic data center consolidation and simplification initiatives.
I invite you to check out some useful related configuration knowledge base articles, blog posts and video segments:
Related Blogs and References:
