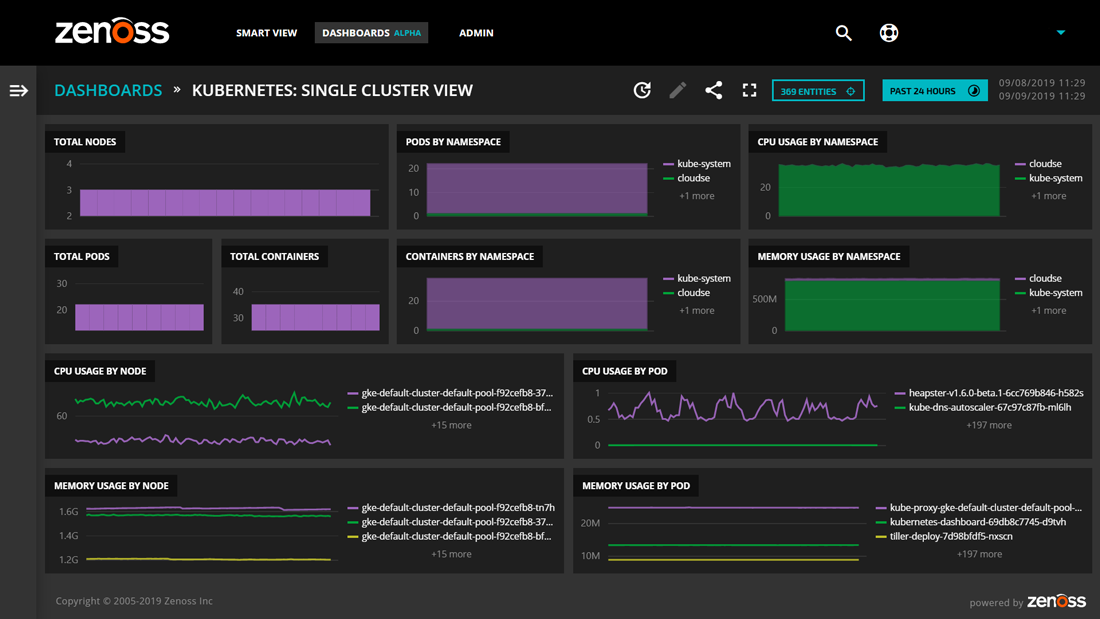

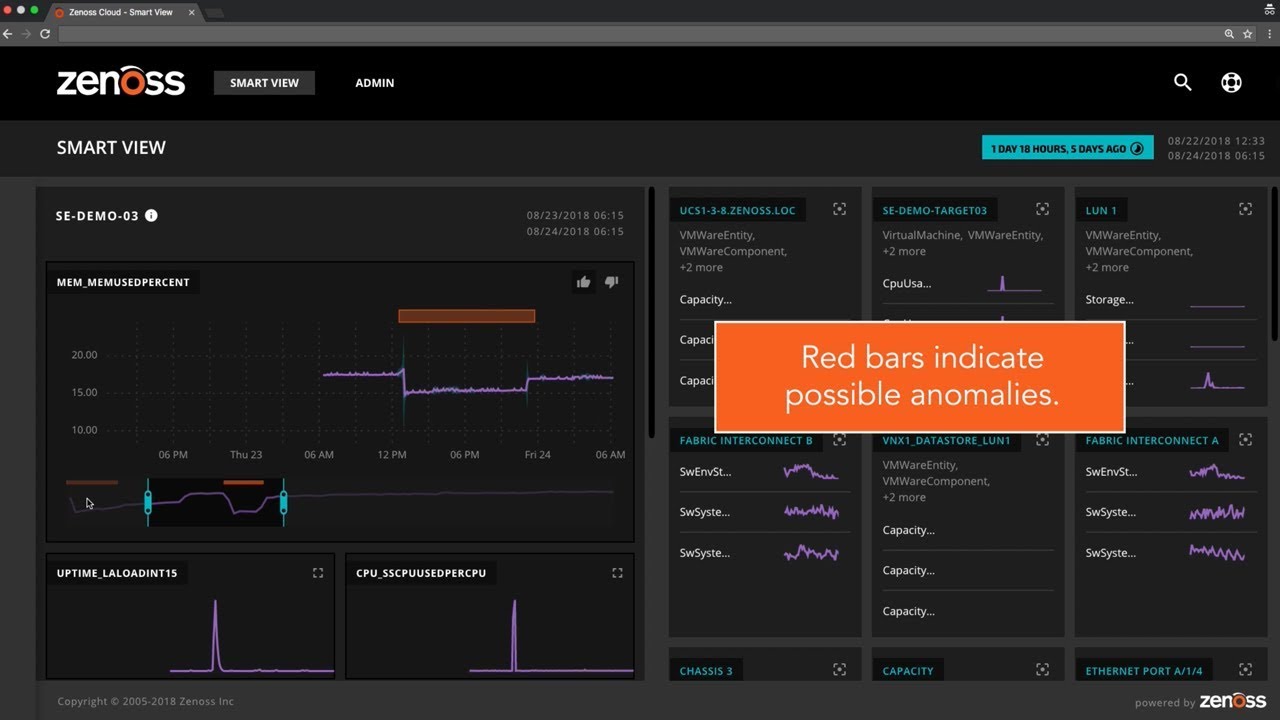
ANOMALY DETECTION
Get immediate root-cause analysis via model-informed machine learning.
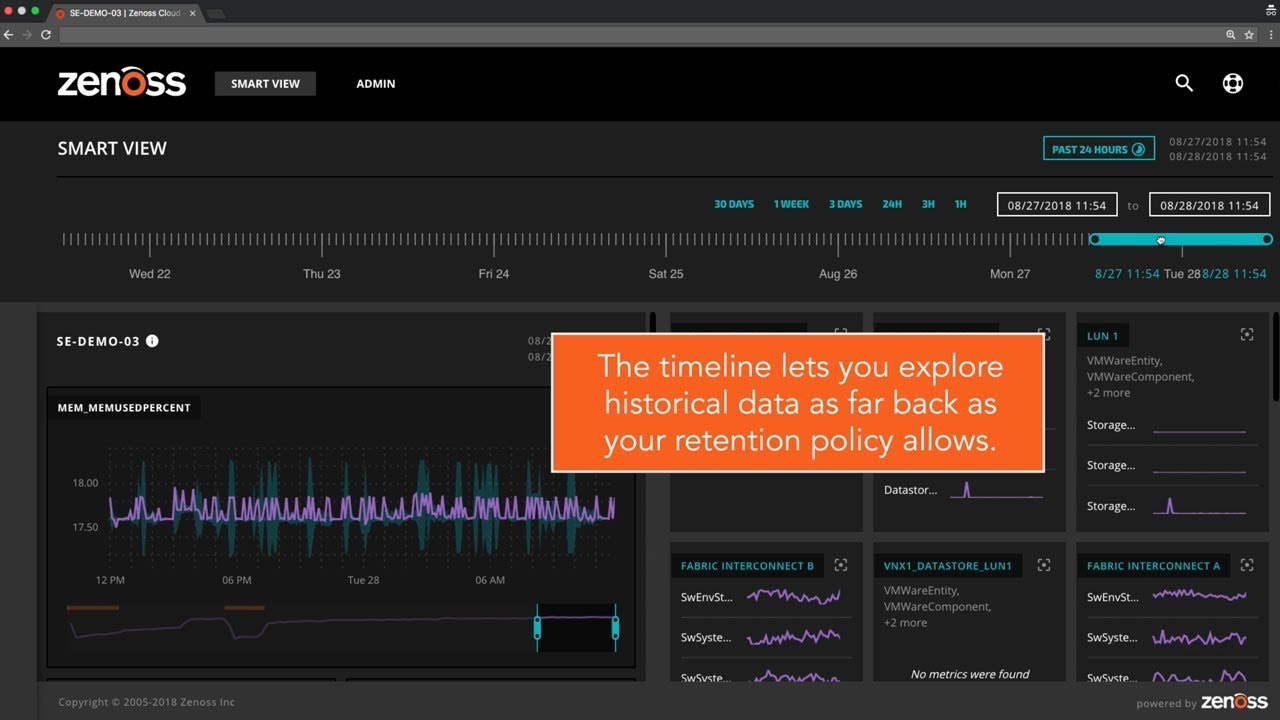
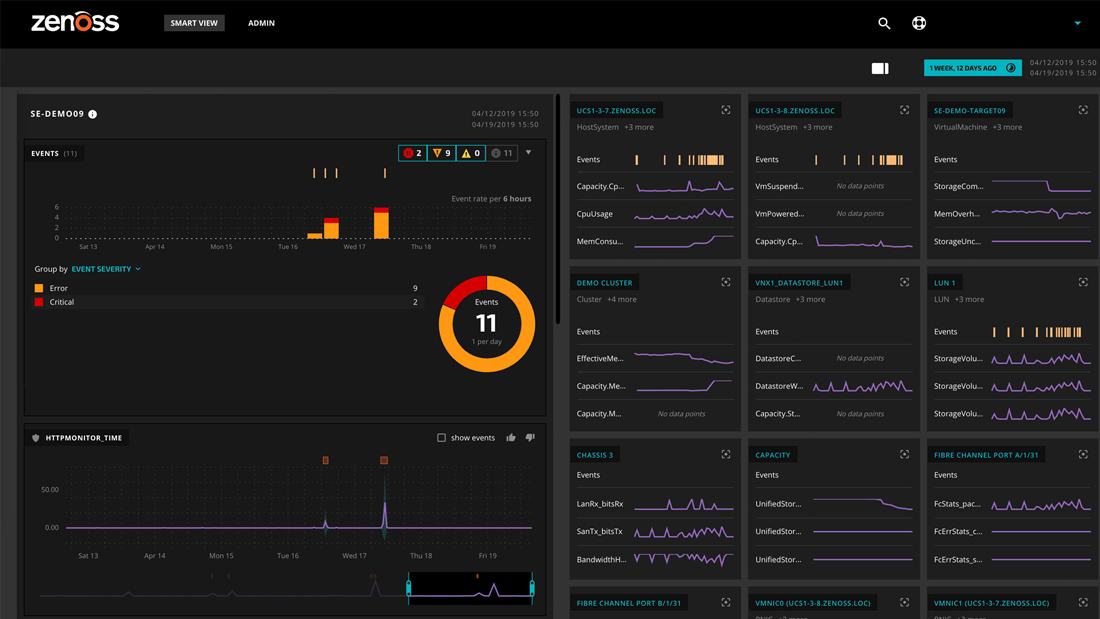
TIMELINE
See performance status and state of all systems and applications at any point in time.
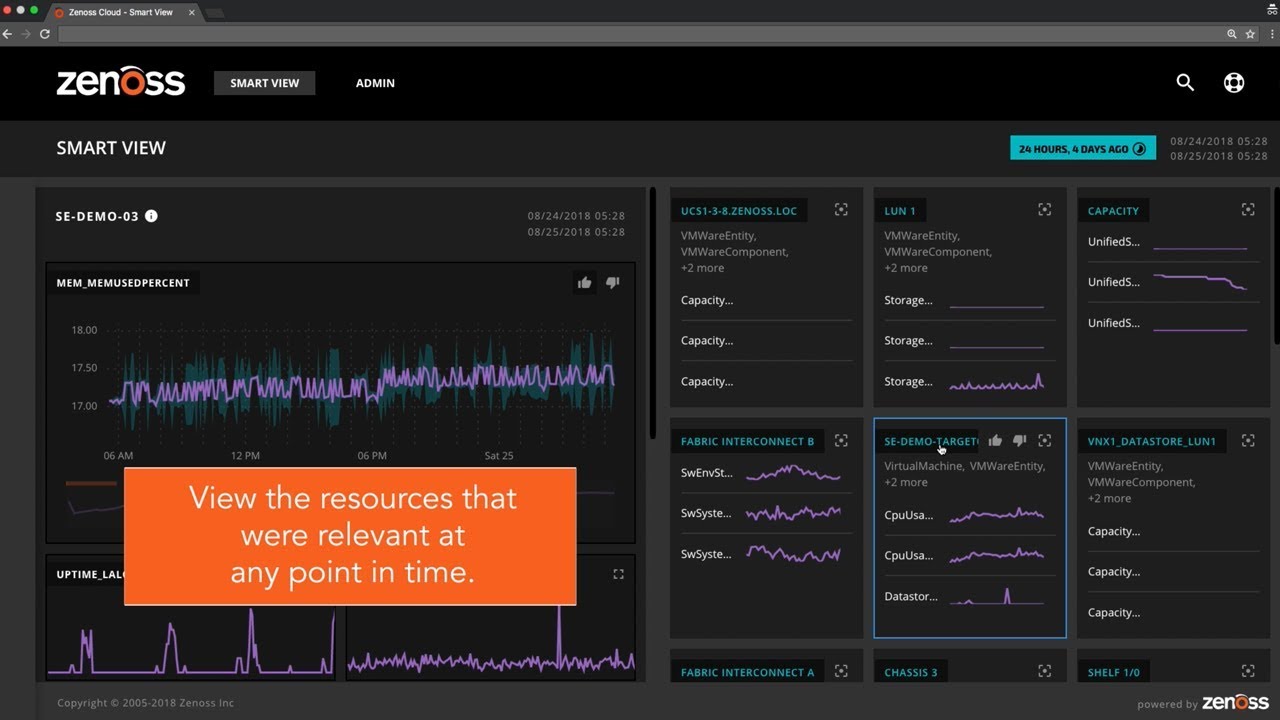
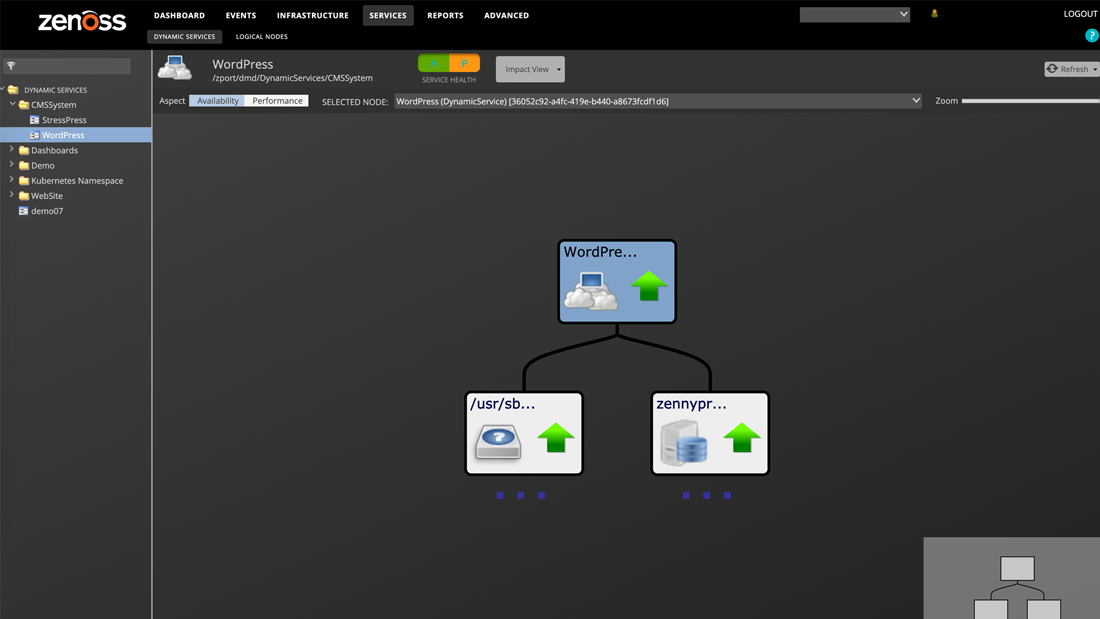
RELATED ENTITIES
Leverage real-time models to surface and understand all dependencies.
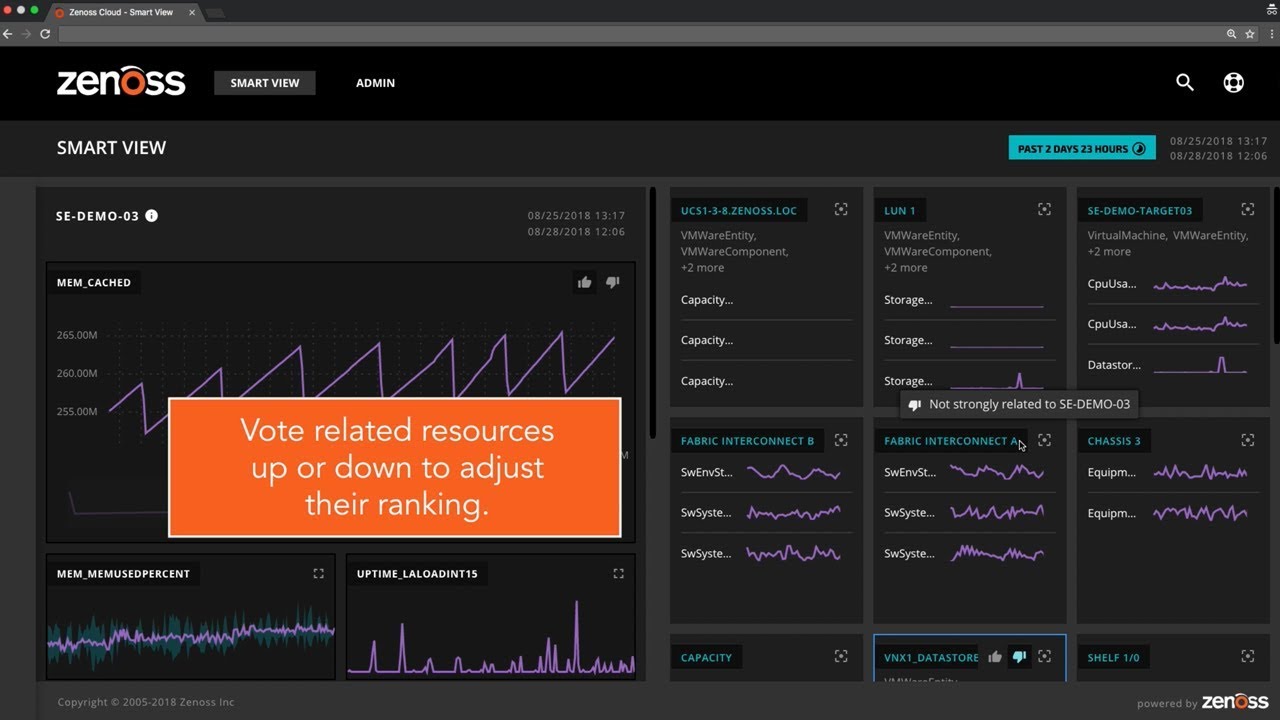
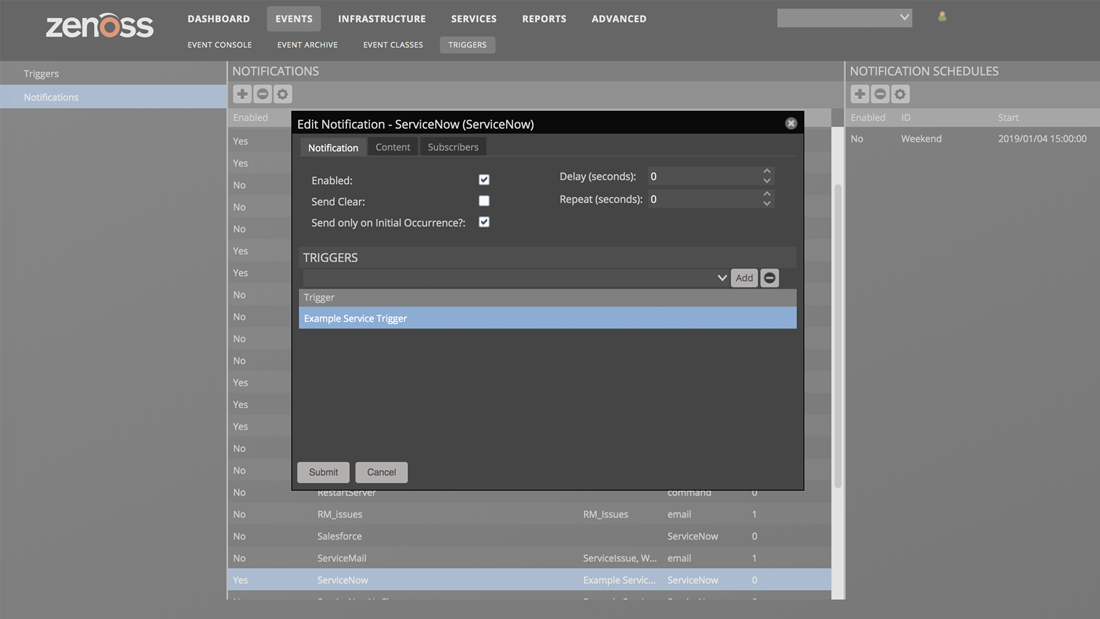
VOTING
Raise visibility of key events dynamically with supervised machine learning.